All published articles of this journal are available on ScienceDirect.

MiR-214-3p Regulates Apoptosis of Ameloblasts under Excessive Fluoride via PI3K/AKT Signaling Pathway
Authors Info & Affiliations
Abstract
Background
Excessive intake of fluoride during enamel growth and development can impair the normal physiological function of ameloblasts, resulting in the formation of dental fluorosis. However, little is known about the function of miRNAs in the formation of dental fluorosis.
Aim
This study aimed to explore the effects of key miRNAs on the PI3K/AKT signaling pathway and ameloblasts under high fluoride conditions.
Materials and Methods
LS8 cells were treated with NaF at concentrations of 0.4, 0.8, 1.6, 3.2, and 6.4 mmol/L for 24 h, and cell viability and apoptosis were measured using the CCK-8 assay and flow cytometry. The expression of apoptosis-related proteins was detected by Western blotting. Transcriptome sequencing was performed on FS8 cells after treatment with 1.6 and 3.2 mmol/L NaF for 24 h to identify key miRNAs and validate them. After cell transfection, the effect of miR-214-3p on ameloblasts and the PI3K/AKT signaling pathway was assessed.
Results and Discussion
NaF treatment significantly reduced the viability and accelerated the apoptosis of LS8 cells. The down-regulated miRNAs predicted target genes that were most enriched in the PI3K/AKT signaling pathway, and the most critical miRNA was miR-214-3p. The expression levels of p-PI3K, p-AKT, and Bcl-2 were significantly up-regulated after overexpression of miR-214-3p in LS8 cells, while the expression of PI3K, AKT, and Bax was significantly down-regulated, which was partially reversed by LY294002.
Conclusion
Excess fluoride could affect the morphology of ameloblast-like cell lines and induce apoptosis. Overexpression of miR-214-3p inhibited NaF-induced apoptosis in LS8 cells by regulating the PI3K/AKT signaling pathway, inhibiting its phosphorylation, down-regulating the Bax protein, and up-regulating the Bcl-2 protein.
1. INTRODUCTION
Fluoride is an element widely present in the environment. Long-term excessive intake of fluoride could lead to chronic fluorosis. Teeth are one of the main target organs for endemic fluorosis, and dental fluorosis is caused by enamel hypoplasia due to excessive fluoride intake during tooth development and formation [ 1, 2]. Clinically, dental fluorosis manifests as yellow or dark brown chalky enamel, with severe tooth defects often accompanied by changes in tooth morphology [ 3]. The occurrence of dental fluorosis is regional and usually occurs in populations born and raised in areas of high fluoride [ 4]. China is one of the most severely fluoridated countries in the world, and the overall prevalence rate of dental fluorosis in China in 2020 was about 23.6% [ 5]. Guizhou province is a high-prevalence area of dental fluorosis in China. Although the prevalence of dental fluorosis in Guizhou province has been on the decline with the implementation of energy renovation and endemic disease control policies in recent years [ 6], the damage and destruction of dental enamel by fluoride is irreversible and leaves long-term cumulative effects on the health of patients. Studies have shown that patients with dental fluorosis are more susceptible to periodontitis and dental caries [ 7, 8].
The differentiation and development of ameloblasts are key to enamel formation, which occurs via three main functional stages: pre-secretory, secretory, and maturation [ 9, 10]. During the pre-secretory phase, changes in the polarity of ameloblasts stimulate their differentiation, leading to an obvious increase in organelles involved in protein synthesis in preparation for the secretion of the enamel matrix. During the secretory phase, ameloblasts become highly columnar and highly polarized, with Tomes’ processes extending to the head of the enamel matrix to help ameloblasts synthesize and secrete enamel matrix proteins (EMPs), thus increasing the thickness of enamel volume and making it develop a necessary proteolytic activity. During the maturation phase, ameloblasts secrete matrix metalloproteinase to degrade matrix proteins. With the thickening of the enamel layer and the mineralization process, the hardness of the enamel increased, forming a highly mineralized hard tissue. Excessive intake of fluoride can affect the normal physiological function of ameloblasts during enamel development and formation, leading to the development of dental fluorosis [ 11, 12]. Therefore, it is important to elucidate the mechanism of fluoride's effect on ameloblasts for the prevention and treatment of dental fluorosis.
MicroRNAs (miRNAs) are small non-coding RNA molecules [ 13] that play a regulatory role in the occurrence and development of many human diseases, such as retinal diseases, neurodegenerative diseases, cardiovascular diseases, and skeletal fluorosis, and have gradually been recognized as potential biomarkers for disease diagnosis and prognosis [ 14]. Tooth growth is driven by adult epithelial stem cells, which first produce ameloblasts, and then ameloblasts produce enamel. MicroRNAs play an important role in these processes. Jevnaker and Osmundsen identified eight miRNAs involved in tooth formation using miRNA microarrays, of which miR-31 was upregulated during molar morphogenesis [ 15]. Cao et al. discovered that miR-200c/141 knockout mice exhibited defects in enamel formation [ 16]. However, little is known about the function of miRNAs in the formation of dental fluorosis.
In this study, we measured cell viability and apoptosis by treating FS8 cells with different concentrations of NaF and then selected FS8 cells treated with NaF (1.6 and 3.2 mmol/L) for 24 h for transcriptome sequencing to identify key miRNAs. Through cell transfection, we explored the effects of key miRNAs on the PI3K/AKT signaling pathway and ameloblasts under high fluoride conditions, providing potential insights into the prevention and treatment of dental fluorosis.
2. METHODS
2.1. Fluorine Exposure and Morphological Observation of Cells
LS8 cells (kindly provided by Professor Malcolme Snead of the University of Southern California and Professor Xiaohong Duan of the Fourth Military Medical University) were inoculated in the medium (1×10⁴ cells/mL) to a density of 50%. Afterward, 0.42 g of NaF was added to 100 mL of pure water and then mixed and diluted to 0.4, 0.8, 1.6, 3.2, and 6.4 mmol/L. The diluted solutions were added to the medium inoculated with cells and incubated for 24 h, 48 h, and 72 h, respectively. No NaF treatment was used in the blank group. The cell morphology was observed under a microscope.
2.2. Cell Viability Assay
Cell viability was assessed to detect the effect of NaF on LS8 cells. For this purpose, 100 μL LS8 cell suspension (1×10 4 cells/mL) was seeded in a 96-well plate at 37°C for 24 h and then treated with 100 μL NaF solution (0.4, 0.8, 1.6, 3.2, and 6.4 mmol/L) for 24 h, 48 h, and 72 h, respectively. Afterward, 10 μL of CCK8 reagent was added to each well, and the absorbance of each well was measured at 450 nm using a microplate reader after 2 h of incubation.
2.3. Cell Apoptosis Assay
For cell apoptosis analysis, LS8 cells were treated with NaF (0.4, 0.8, 1.6, 3.2, and 6.4 mmol/L) for 24 h, digested with EDTA-free trypsin and centrifuged for 5 min at 1000 rpm. Cells were then incubated with 5 μL Annexin V-FITC and 10 μL PI for 10 min and then resuspended in 300 μL 1X binding buffer. The stained cells were measured using a FACS Calibur Flow Cytometer and analyzed by CellQuest.
2.4. MicroRNA Extraction and Library Preparation
LS8 cells were treated with NaF (1.6 and 3.2 mmoL/L) for 24 h, and the untreated cells were used as the blank group. The cell precipitates were collected and added to TRIzol for full lysis. MicroRNAs were extracted using mirPremier. The method of library preparation was described by Nirvabi et al. [ 17].
2.5. MicroRNA Sequencing and Data Analysis
MiRNA libraries were sequenced. To improve the quality of the sequencing reads, we excluded the following types of reads: (i) reads have no more than 4 bases with a base mass less than 10 and no more than 6 bases with a base mass less than 13; (ii) reads with contaminated connector; (iii) reads that insert fragments too long; and (iv) Reads with high content of unknown base N. We used Mus_musculus (GCF_000001635.26_GRCm38.p6) as the reference genome. All clean reads were mapped to this reference genome by Bowtie2 software [ 18].
Differential expression of miRNAs was calculated by DEGseq software. The significance ( P-value) of each gene was adjusted using Q-values to screen for differentially expressed genes with Q-values <0.001 and |log2 (fold change)|>2 considered as significant. Differentially expressed miRNAs were screened between the two NaF-treated groups and the blank group, respectively, and the intersection of the two differential results was taken for subsequent analysis. Kyoto Encyclopedia of Genes and Genomes (KEGG) enrichment analysis of candidate target genes was performed by the R-package clusterProfiler.’
2.6. Validation of microRNA-Sequenced Data with Reverse Transcription-quantitative PCR
RNA was extracted by the Total RNA Extraction Kit and then miRNA first-strand cDNA synthesis was performed. The obtained cDNA product was diluted 50-fold and used as a template for subsequent experiments. RT-qPCR experiment was conducted by the miRNA first strand cDNA synthesis kit (Shanghai Shengong Bioengineering Co., Ltd.). The primers used for the RT-qPCR are listed in Table 1.
2.7. Cell Transfection
MiR-214-3p mimic (5’-ACAGCAGGCACAGACAGGCAG T-3’) and miR-NC were purchased from RiboBio Co., Ltd. LS8 cells were cultured on a 6-well plate and divided into a blank group, NaF group, NaF+miR-214-3p mimic group, NaF+miR-214-3p mimic NC group, and NaF+miR-214-3p mimic+LY294002 group. When the cell density grew to about 40% confluence, the cells were transfected by miR-214-3p mimic for 24 hours. RNA samples were collected, and RT-qPCR was performed.
2.8. Western Blotting
Proteins were extracted from LS8 cells, processed by SDS-PAGE and transferred to a PVDF membrane. After being blocked by 5% defatted milk for 2 h, the membrane was incubated with the primary antibodies (Cambridge, MA, USA), anti-PI3K, anti-p-PI3K, anti-AKT, anti-p-AKT, anti-Bcl-2, anti-Bax, and anti-β-actin overnight and with the secondary antibody conjugated with horseradish peroxidase (Rockland, USA) for 1 h.
| Primer | Sequence (5’- 3’) |
|---|---|
| miR-21a-3p | CAACAGCAGTCGATGGGCTGTC |
| miR-324-5p | CGCATCCCCTAGGGCATTGGTGT |
| miR-3110-5p | TTCTGCCTCCCCTGAAGGCTC |
| miR-574-5p | TGAGTGTGTGTGTGTGAGTGTGT |
| miR-210-5p | AGCCACTGCCCACCGCACACTG |
| miR-214-3p | ACAGCAGGCACAGACAGGCAGT |
2.9. Statistical Analysis
GraphPad Prism 8.0 and SPSS 18.0 software were used for statistical analysis. The measurement data are expressed as mean ± standard deviation (mean ± SD). Statistical differences between the two groups were determined using Student's t-test. One-way ANOVA, followed by Tukey's post hoc test, was used for comparisons between >2 groups. A p-value of <0.05 was considered statistically significant. All results were reproduced in at least three independent experiments.
3. RESULTS
3.1. NaF Disrupted the Normal Morphology of LS8 Cells
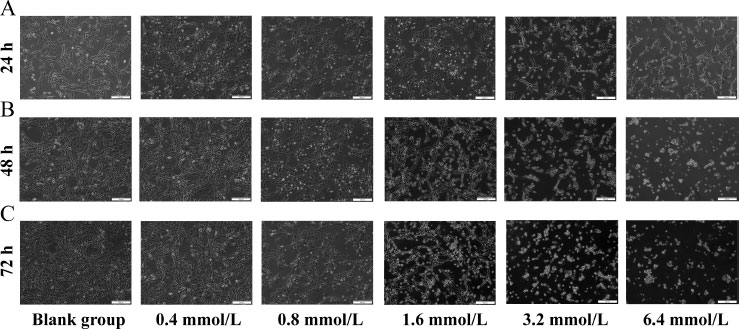
Under normal growth conditions, the growth cycle of ameloblasts was about 48 hours, and their shape was fusiform or polygonal, with closely connected cells arranged in a cobblestone pattern. LS8 cells were treated with NaF (0.4, 0.8, 1.6, 3.2, and 6.4 mmol/L) for 24 h, 48 h, and 72 h, respectively. Compared with the blank group, the cells in the 0.4 and 0.8 mmoL/L concentration groups showed no significant changes in morphology at 24 h (Fig. 1A). The cells in the 1.6 and 3.2 mmoL/L concentration groups became loose from each other and showed visible cell crumpling. The cells in the 6.4 mmoL/L concentration group even showed partial cell death. The same trend was observed at the two other time points (48 h and 72 h) (Fig. 1B, C). We also observed that the cells treated with the same concentration of NaF showed more pronounced changes in cell morphology with increasing treatment time compared to the blank group (Fig. 1).
3.2. NaF Inhibited the Viability of LS8 Cells
The CCK-8 assay revealed that the inhibitory effect on cell viability was stronger with increasing NaF concentration at the same time point (Fig. 2A-D). Similarly, the longer the treatment time after the same NaF concentration, the stronger the inhibitory effect on cell viability (Fig. 2A and Table S1). The above results indicated that NaF treatment could significantly reduce the viability of LS8 cells.
3.3. NaF Induced Apoptosis of LS8 Cells by Increasing Caspase-3 and Bax and Decreasing Bcl-2 Levels
The results of flow cytometry analysis revealed that after 24 h of NaF treatment, there was no significant difference in the apoptosis rate between the 0.4 and 0.8 mmol/L NaF groups (Cell apoptosis rates: 7.01 ± 0.59% and 7.91 ± 0.49%, P > 0.05) compared to the blank group (Cell apoptosis rate: 6.06 ± 1.2%), whereas NaF at concentrations of 1.6, 3.2 and 6.4 mmol/L significantly induced cell apoptosis (Cell apoptosis rates: 39 ± 2.63%, 58.2 ± 0.1% and 68.97 ± 1.47%, P < 0.05) (Fig. 3A). The above results indicated that NaF treatment could significantly accelerate the apoptosis of LS8 cells.

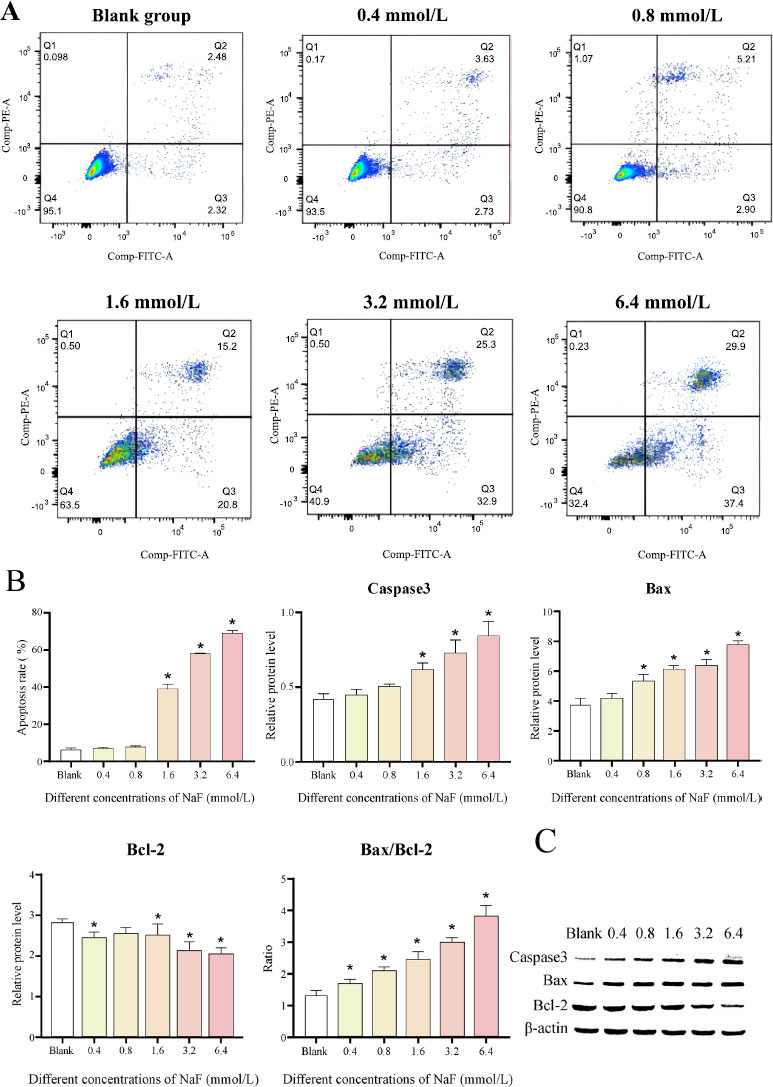
We further determined the levels of apoptosis-related proteins. The results revealed that the expression of the pro-apoptotic factors Caspase3 and Bax was increased after treatment with different concentrations of NaF, while the expression of the apoptosis-inhibiting factor Bcl-2 was decreased (Fig. 3B, C and Table S2). The differences in the expression of Caspase3, Bax, and Bcl-2 were not significant ( P > 0.05) at low NaF concentrations (0.4/0.8 mmol/L) compared to the blank group, while the differences became significant ( P < 0.05) at high NaF concentrations (1.6, 3.2 and 6.4 mmol/L). In addition, Bax can form a heterodimer with Bcl-2, thereby inhibiting Bcl-2 activity and promoting the occurrence of apoptosis. We examined the ratio of Bax to Bcl-2 and found that the ratio increased with increasing NaF concentrations (Fig. 3B, C and Table S2). The above results suggested that higher NaF concentrations lead to more obvious apoptosis.
3.4. Detection of MicroRNAs in LS8 Cells
In the above results, we found a significant difference between the results at high NaF concentrations (1.6, 3.2, and 6.4 mmol/L) compared to the blank group, but the number of cells with activity was low at a concentration of 6.4 mmol/L. We finally selected NaF-treated cells (1.6 and 3.2 mmol/L) for 24 h for transcriptome analysis. Transcriptome analysis was carried out in triplicate for all three groups, and a total of 9 cDNA libraries, named C (1, 2, 3), T1 (1, 2, 3), and T2 (1, 2, 3), were constructed and sequenced.
After filtering the low-quality reads, the number of clean reads obtained per sample ranged from 20,759,412 to 22,090,808 (Table S3). We performed a comparative analysis between the 1.6 and 3.2 mmol/L NaF groups and the blank group to screen for 93 and 128 significantly differentially expressed genes, respectively. The intersection of these two results was taken, resulting in the identification of 30 up-regulated and 30 down-regulated miRNAs (Fig. 4A, B). We further performed target gene prediction for up-regulated miRNAs and down-regulated miRNAs and obtained 1,175 and 1,345 target genes, respectively. KEGG enrichment analysis of these candidate target genes showed that the target genes predicted by up-regulated miRNAs were most significantly enriched in the Rap1 signaling pathway (Fig. 4C), and those predicted by down-regulated miRNAs were most significantly enriched in the PI3K/AKT signaling pathway (Fig. 4D).

3.5. Analysis of Target Network Interaction and Verification of Analysis with RT-qPCR
Target network interaction analysis between the up-regulated miRNA and target genes in the Rap1 signaling pathway showed that miR-3110-5p was in the center of the network graph and had the largest number of node connections (Fig. 5A). Target network interaction analysis between the down-regulated miRNA and the target genes in the PI3K/AKT signaling pathway showed that miR-214-3p was in the center of the network graph and had the largest number of node connections (Fig. 5B).
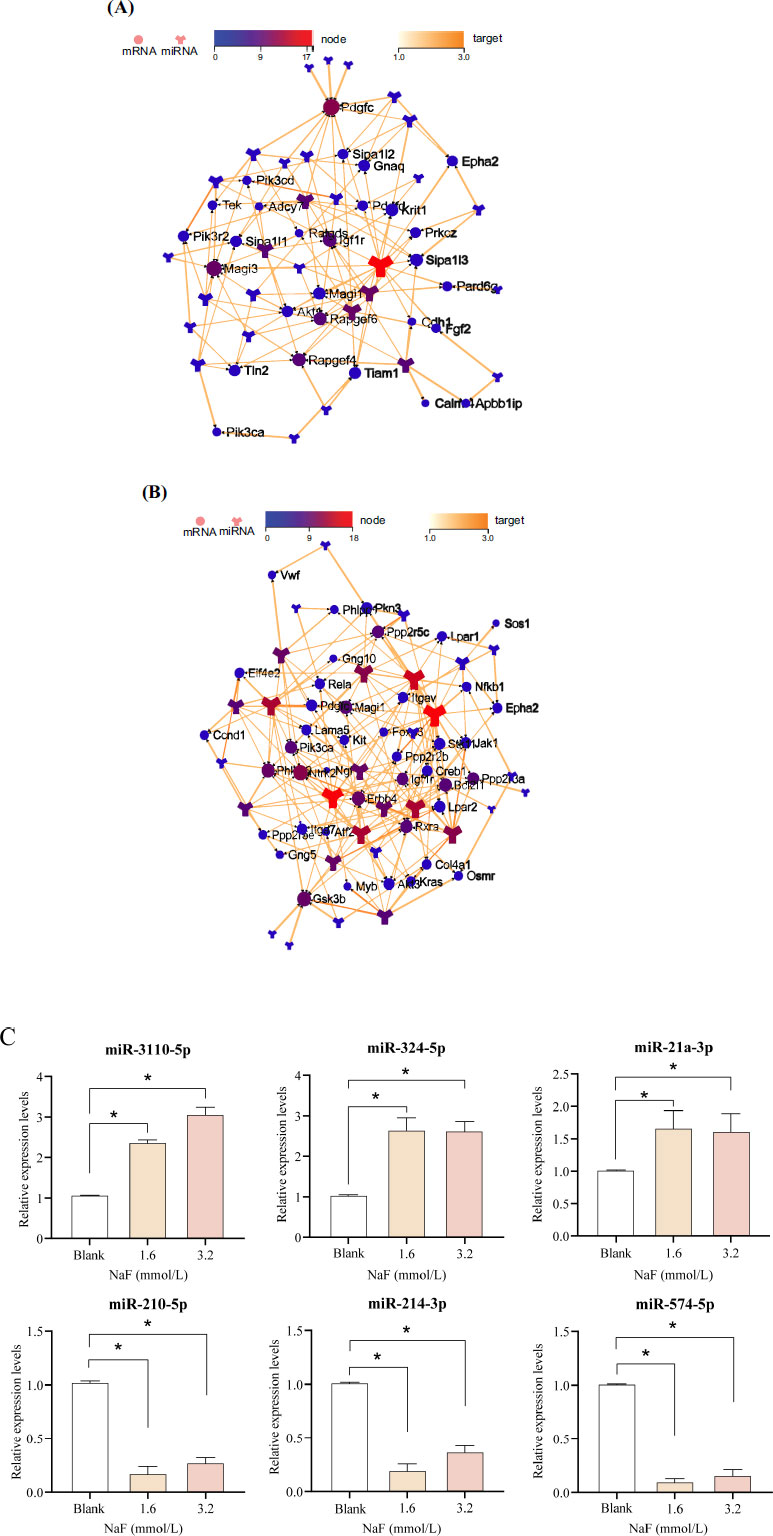
Apart from miR-3110-5p and miR-214-3p, we also selected the 2 miRNAs with the highest number of node connections (up-regulated: miR-324-5p and miR-21a-3p; down-regulated: miR-210-5p and miR-574-5p) for validation, respectively. Compared with the blank group, the expression of miR-3110-5p, miR-324-5p, and miR-21a-3p were significantly up-regulated ( P < 0.05) in the 1.6 and 3.2 mmol/L NaF groups, whereas the expression of miR-214-3p, miR-210-5p, and miR-574-5p were significantly down-regulated ( P < 0.05), which was consistent with the sequencing results (Fig. 5C and Table S4). It has been shown that the PI3K/AKT signaling pathway plays an important role in the regulation of apoptosis, and PI3K was confirmed to be a direct target gene of miR-214-3p [ 19]. Combining the above results in this study, we selected miR-214-3p to investigate its potential mechanism in the apoptosis of ameloblasts induced by excessive fluoride.
3.6. Overexpression of miR-214-3p inhibited NaF-induced apoptosis in LS8 cells by regulating the PI3K/AKT Signaling Pathway
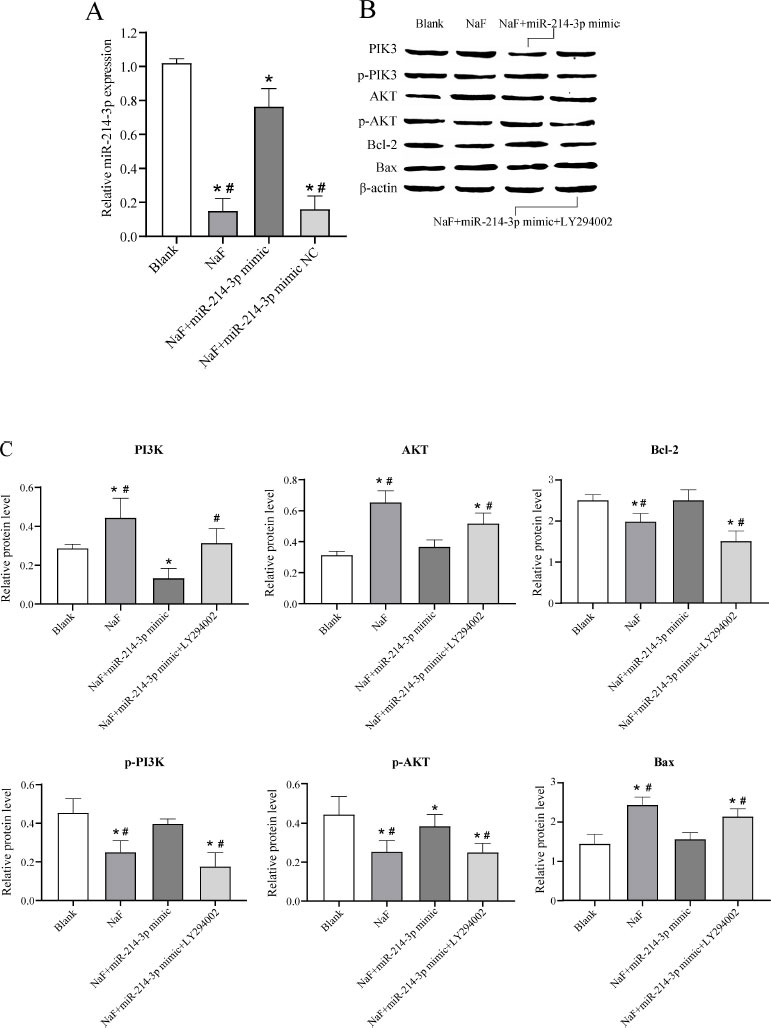
To further investigate the effect of miR-377-3p on the apoptosis of LS8 cells under NaF treatment, LS8 cells were transfected with NaF, NaF+miR-NC, NaF+miR- 214-3p mimic, or NaF+miR-214-3p mimic+LY294002. RT-qPCR analysis revealed that the expression level of miR-214-3p was significantly up-regulated in cells transfected with NaF+miR-214-3p mimic compared to the NaF group and NaF+miR-214-3p mimic NC group (Fig. 5A), indicating successful transfection of the miR-214-3p mimic. In addition, the expression levels of miR-214-3p were significantly downregulated in cells transfected with NaF, NaF+miR-NC, and NaF+miR-214-3p mimic compared to the blank group, indicating that NaF could inhibit miR-214-3p expression to some extent (Fig. 6A).
Subsequently, Western blot experiments were performed and the results showed that the expression of PI3K, AKT, and the pro-apoptosis protein Bax in the NaF group was significantly increased, while the expression of p-PI3K, p-AKT, and anti-apoptosis protein Bcl-2 was significantly decreased ( P < 0.05) compared to the blank group, indicating that excessive fluoride could promote apoptosis via the PI3K/AKT signaling pathway (Fig. 6B, C and Table S5). The expression of PI3K, AKT, and pro-apoptotic protein Bax was significantly decreased in the NaF+miR-214-3p mimic group compared to the NaF group, while the expression of p-PI3K, p-AKT, and anti-apoptotic protein Bcl-2 was significantly increased ( P < 0.05), indicating that miR-214-3p could inhibit NaF-induced cell apoptosis by regulating the PI3K/AKT signaling pathway (Fig. 6B, C, Table S5). When cells were transfected with NaF+miR-214-3p mimic+PI3K inhibitor (LY294002), the expression of PI3K, AKT, and pro-apoptosis protein Bax was increased and the expression of p-PI3K, p-AKT and anti-apoptosis protein Bcl-2 was decreased ( P < 0.05), further validating the above results (Fig. 6B, C, Table S5). These results suggested that miR-214-3p overexpression may inhibit the NaF-induced apoptosis of LS8 cells via the PI3K/AKT signaling pathway and thereby have a preventive and therapeutic effect on dental fluorosis.
4. DISCUSSION
Excess fluoride affects the normal mineralization of tooth enamel, resulting in the formation of dental fluorosis. The main feature of dental fluorosis is damage to the enamel, which not only affects the appearance but also has a negative psychological impact on the patient. A growing number of research works have revealed the important role of miRNAs in many diseases, but few have revealed the effects of miRNAs on dental fluorosis. In this study, we found that NaF treatment could significantly reduce the viability of LS8 cells and accelerate the apoptosis of LS8 cells, and further explored the effects of key miRNAs on PI3K/AKT signaling pathway and ameloblasts under high fluoride conditions, providing potential insights into the prevention and treatment of dental fluorosis.
Studies have reported that excessive intake of fluoride during the growth and development of enamel can impair the normal physiological function of ameloblasts, resulting in the formation of dental fluorosis [ 20-22]. In this study, LS8 cells were treated with different concentrations of NaF. Consistently, our results confirmed that NaF treatment significantly reduced the viability and accelerated the apoptosis of LS8 cells.
In this study, FS8 cells were treated with NaF (1.6 and 3.2 mmol/L) for 24 h. The most critical miRNA was miR-214-3p, which was screened by transcriptome sequencing analysis. MiR-214-3p has been reported to play a key role in skeletal disorders [ 23]. Cao et al. found that a decrease in miR-214-3p promoted chondrocyte apoptosis and aggravated the progression of osteoarthritis by activating the NF-kB pathway [ 24]. Teng et al. revealed that miR-214-3p inhibited the β-catenin signaling pathway, leading to delayed fracture healing [ 25]. Wang et al. found that miR-214-3p could regulate the Wnt/β-catenin signaling pathway by binding to the 3′-UTR of β-catenin to reduce the mRNA and protein levels of β-catenin, thus contributing to the inhibition of osteogenic differentiation [ 26]. Furthermore, studies have shown that oxidative stress damage is an important pathogenic factor in dental fluorosis. The Nrf2 signaling pathway plays a regulatory role by activating the expression of various intracellular antioxidant enzymes [ 27, 28]. The miR-214-3p promoter was found to bind to Nrf2, and forsythoside-β could inhibit miR-214-3p levels by activating Nrf2, thereby alleviating inflammatory osteoporosis [ 29]. The TGF-β/BMP/Smad signaling pathway also plays a regulatory role in enamel development and dental fluorosis formation. BMP is the most important subfamily of the TGF-β superfamily and is involved in the formation of bone and tooth tissues. Smad is an important downstream regulator of BMP. Excessive fluoride could decrease the expression of TGF-β1, BMP2, and Smad4 in ameloblasts and inhibit the proliferation and differentiation of ameloblasts and the synthesis and secretion of the matrix. MiR-214-3p could inhibit the BMP/Smad signaling pathway and delay fracture healing in osteoporotic fracture rats [ 30]. The results revealed that excessive fluoride induced the down-regulation of miR-214-3p. Moreover, KEGG enrichment analysis showed that miR-214-3p might be a key miRNA of the PI3K/AKT signaling pathway. Thus, we hypothesized that excessive fluorine might induce ameloblast apoptosis via the regulation of the PI3K/AKT signaling pathway by miR-214-3p, and, therefore, we performed subsequent experimental validation.
It has been shown that the PI3K/AKT signaling pathway is closely related to apoptosis, and PI3K was confirmed to be a direct target gene of miR-214-3p [ 19]. The PI3K/AKT signaling pathway plays a key role in the signal transduction of various growth factors, cytokines, and extracellular matrix, thereby affecting cell survival and apoptosis [ 31, 32]. PI3K is a phosphatidylinositol kinase that phosphorylates the third hydroxyl of the inositol ring. AKT, a serine/threonine protein kinase, is a major downstream target of PI3K, controlling cell proliferation, apoptosis, and cell cycle [ 33]. When PI3K is stimulated and activated by various extracellular signals, it catalyzes phosphatidylinositol diphosphate to produce phosphatidylinositol 3,4,5-triphosphate, which then acts as a second messenger in the cell to bind and activate AKT [ 34, 35]. The activation of AKT in vivo and in vitro depends on phosphorylation. When the phosphorylation of the PI3K/AKT signaling pathway is enhanced, it inhibits apoptosis, and when the phosphorylation is weakened, the inhibition of apoptosis is also reduced. The proteins Bcl-2 and Bax are critical in the apoptotic process [ 36]. The Bcl-2 determines to some extent whether cells undergo apoptosis or survive [ 37]. Bax can form a heterodimer with Bcl-2, thereby inhibiting Bcl-2 activity and promoting the occurrence of apoptosis. In this study, the results showed that the phosphorylation levels of PI3K/AKT signaling pathway-related proteins p-PI3K and p-AKT and the expression level of anti-apoptotic protein Bcl-2 were significantly up-regulated following the overexpression of miR-214-3p in LS8 cells, while the expression of PI3K, AKT, and pro-apoptotic protein Bax was significantly down-regulated, suggesting that miR-214-3p over expression may inhibit phosphorylation and induce the NaF-induced apoptosis of LS8 cells via the PI3K/AKT signaling pathway and Bax and Bcl-2. To further verify whether the PI3K/AKT pathway is involved in apoptosis under the influence of excessive intake of fluoride, we selected LY294002 to inhibit PI3K function and found that those effects mentioned above were largely reversed by LY294002, thus further confirming the above findings.
CONCLUSION
The findings of this study suggested that excessive fluoride could affect the typical morphology of ameloblasts and induce apoptosis. Moreover, miR-214-3p was found to play an important role in inhibiting cell apoptosis induced by excessive fluoride by targeting the PI3K/AKT signaling pathway, inhibiting its phosphorylation, down-regulating Bax proteins, and up-regulating Bcl-2 proteins. These findings may provide new perspectives for basic research on dental fluorosis and offer more effective targets and strategies for clinical diagnosis, treatment, and prevention.
LIST OF ABBREVIATIONS
| EMPs | = Enamel Matrix Proteins |
| PI3K | = PhosphoInositide-3 Kinase |
| AKT | = Protein Kinase B |
AVAILABILITY OF DATA AND MATERIALS
The datasets used and/or analysed during the current study are available from the corresponding author [G.B] upon reasonable request.
FUNDING
This work was supported by the National Natural Science Foundation of China (No. 81960198), Zunyi Oral Disease Immune Prevention and Medical Biomaterials Research and Development Innovation Talent Team (Zunyi Science Talent [2022] No.1), Zunyi Science and Technology Plan Project (No. Zunshi Kehe HZ Zi (2022) 425; Zunshi Kehe HZ Zi (2023) 83), and Zunyi Medical University “12345 Future Talent Training Program” Talent Project–Future Teaching Master.