All published articles of this journal are available on ScienceDirect.

Cone-beam Computed Tomography Evaluation of Upper Airway Morphology and its Association with Age, Gender, and Body Mass Index in Healthy Adults
 iD
iD
Authors Info & Affiliations
Abstract
Introduction
This cross-sectional study used Cone-Beam Computed Tomography (CBCT) to evaluate the association between the Upper Airway (UA) volume and demographic risk factors, including age, gender, and Body Mass Index (BMI), in healthy Indonesian adults.
Materials and Methods
A retrospective cross-sectional study was conducted on 85 CBCT datasets (45 males, 40 females; ages 20-40 years). Upper airway segmentation was performed using CS 3D Imaging Software to obtain the measurement parameters, such as total UA volume, minimal cross-sectional area (CSAmin), and lateral and anteroposterior CSAmin dimensions. Inter- and intra-rater reliability were assessed using Intraclass Correlation Coefficients (ICC). Correlation analyses (Spearman’s Rho) and group comparisons were used to evaluate associations between airway parameters and age, gender, and Body Mass Index (BMI).
Results
A reliability test for the upper airway measurement parameters was conducted by two examiners over a two-week interval, and the findings indicated that inter-rater reliability was excellent (ICC=0.99), and intra-rater reliability was good (ICC=0.80-0.89). The total UA volume differed significantly by gender (males: 31.7 ± 7.0 cm3; females: 27.1 ± 5.0 cm3; p < 0.05), age group (p < 0.05), and BMI category (p < 0.05). Weak negative correlations were observed between total UA volume and both gender (r = –0.327, p < 0.05) and BMI (r = –0.326, p < 0.05), while age showed no significant correlation. CSAmin and linear dimensions showed no significant correlation with any demographic variable, and all CSAmin values exceeded 110 mm2.
Discussion
In this study, upper airway volume was significantly greater in males than in females, consistent with previous findings. Participants with normal BMI exhibited the highest airway volumes, while overweight individuals showed reduced volumes. On the other hand, age did not correlate significantly with upper airway parameters in this 20- 40-year-old cohort.
Conclusion
Upper airway volume is significantly associated with gender and BMI, but not with age, in healthy adults aged 20-40 years. Three-dimensional CBCT provides reliable measurements for UA assessment and may support early identification of airway alterations in clinical practice.
1. INTRODUCTION
The upper airway is a complex anatomical structure composed of mucosal tissue, musculature, cartilage, and lymphatic elements, and it plays vital roles in respiration and phonation. Alterations in airway morphology may be caused by infectious or non-infectious pathologies, cong-enital conditions, or craniofacial anatomical variations [1].
Previous studies have shown that upper airway volume differs across populations and is influenced by several demographic and anatomical factors. For example, studies in India and South Korea reported that males generally have larger upper airway volumes than females [2]. Risk factors associated with upper airway volume include age, gender, and Body Mass Index (BMI) [3-5]. Most earlier investigations relied on two-dimensional cephalometric radiographs, which are limited by magnification errors, distortion, and superimposition of structures, thereby reducing measurement accuracy [6-10].
Cone-Beam Computed Tomography (CBCT) provides three-dimensional visualization of craniofacial structures with high spatial resolution and relatively low radiation dose, making it a valuable tool for airway assessment. CBCT enables accurate segmentation of the nasopharyngeal, oropharyngeal, and hypopharyngeal regions and has been shown to yield highly reproducible airway measurements. Despite these advantages, a study on the efficacy of upper airway measurements using the three-dimensional imaging modality of CBCT on a phantom was conducted by Aboudara et al., who found that the error range between measurements of volume and sagittal area ranged from 0-5% with moderate correlation (r=0.75), whereas using the lateral cephalometric radiographic method ranged from 2.5-5.7% [7].
Given the importance of establishing population-specific reference values, this study aimed to evaluate the association between upper airway volume and demographic factors, including age, gender, and BMI, using CBCT images of healthy Indonesian adults aged 20–40 years. Understanding these relationships may enhance clinical interpretation of airway anatomy and support early identification of individuals at potential risk for airway-related disorders.
2. MATERIALS AND METHODS
This retrospective cross-sectional study was approved by the Ethics Committee of the Faculty of Dentistry, Universitas Indonesia (Number: 68/Ethical Approval/FKGUI/XI/2023). The study was conducted at the Radiology Unit of the dental hospital of Universitas Indonesia over a period of 1 year, from 2023 to 2024. Eighty-five CBCT datasets were collected, and the medical records of patients were reviewed. The following are the inclusion criteria: (1) an adult group with ages ranging from 20-30 years and 31-40 years, and (2) no history of respiratory problems. According to previous studies, the age groups of 20-30 years and 31-40 years were considered stable. Exclusion criteria in this study were data volumes with a Field of View (FOV) of 10 cm x 5 cm or smaller, regardless of coverage of the boundaries of the upper airway. Informed consent was waived by the Ethics Committee of the Faculty of Dentistry, Universitas Indonesia, because this study used retrospectively collected and fully anonymized CBCT datasets, posing minimal risk to participants.
Before determining the boundaries of UA, which are presented in Table 1, six anatomic landmarks that are relevant for upper airway analysis were located, such as (1) sella turcica (S) is the middle point of the sella turcica, (2) Posterior Nasal Spine (PNS) is the most posterior point of the hard palate, (3) anteroposterior C2 is the midinferior point of cervical vertebra C2, (4) superior point of epiglottis is the midsuperior point of epiglottis, (5) base of epiglottis is the inferior point of epiglottis crypt. The boundaries of the upper airway are shown in Fig. (1).
| Pharyngeal Borders | Definition |
|---|---|
| Total Upper Airway | |
| Anterior boundary | The plane extends through the sella turcica to the PNS, base of the epiglottis, and tip of the epiglottis. |
| Posterior boundary | The plane extends through the sella turcica to the pharyngeal superior wall parallel to the PNS and the pharyngeal inferior wall parallel to the base of the epiglottis. |
| Superior boundary | Sella turcica |
| Inferior boundary | The plane extends through the base of the epiglottis to the inferior posterior wall of the pharynx. |
| Nasofaring | |
| Anterior boundary | The plane extends through the sella turcica to the PNS. |
| Posterior boundary | The plane extends from the sella turcica to the pharyngeal superior wall parallel to the PNS. |
| Superior boundary | Sella turcica |
| Inferior boundary | The plane extends through the sella turcica to the pharyngeal superior wall. |
| Orofaring | |
| Anterior boundary | The plane extends through the PNS to the tip of the epiglottis. |
| Posterior boundary | The plane extends through the pharyngeal superior wall to the pharyngeal midposterior wall. |
| Superior boundary | The plane extends through the PNS to the pharyngeal posterior wall. |
| Inferior boundary | The plane extends through the tip of the epiglottis to the pharyngeal midposterior wall. |
| Hipofaring | |
| Anterior boundary | The plane extends to the base of the epiglottis. |
| Posterior boundary | The plane extends through the pharyngeal midposterior wall to the pharyngeal inferior wall. |
| Superior boundary | The plane extends through the tip of the epiglottis to the pharyngeal midposterior wall. |
| Inferior boundary | The plane extends through the base of the epiglottis to the pharyngeal inferior wall. |
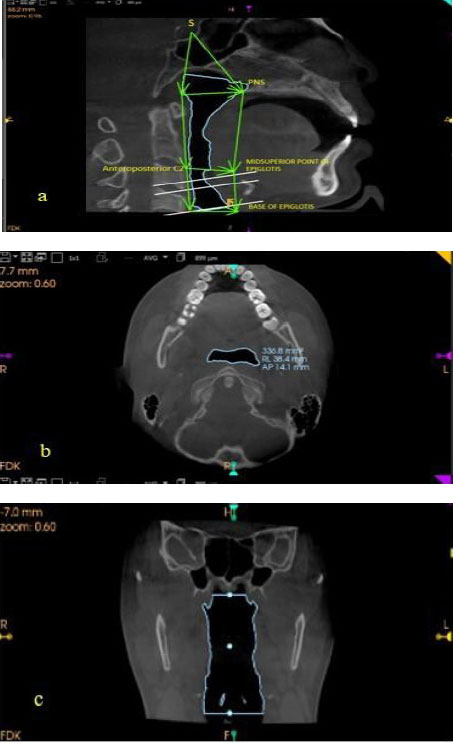
CBCT software (CS 3D Imaging Software 7.0.23 by Carestream Dental, Atlanta) is used to segment the upper airway automatically. (a) In the Midsagittal view, the upper airway boundary is marked with a green line as a region of interest, which is formed by the following anatomical landmarks: sella turcica (S), Posterior Nasal Spine (PNS), anteroposterior C2, the midsuperior point of the epiglottis, the base of the epiglottis, and the seed point as a virtual marker region of interest. (b) The segmentation results are visible in the Axial view, marked with a blue line. (c) The Coronal view is also automatically segmented.
This sample size was calculated using the group mean formula, N = Z2α/2 s2 /d2, with an alpha (α) value of 0.05, and a power of 90% was considered. The calculation was based on a previous study conducted by Daya et.al. [3]. The determination of six anatomic landmarks and upper airway analysis was performed by two observers, senior residents of oral and maxillofacial radiology who were trained and calibrated using two data sets that were not included in this study.
Eighty-five CBCT data sets were reconstructed, and upper airway segmentation analysis was performed using CBCT software (CS 3D Imaging Software 7.0.23 by Carestream Dental, Atlanta). All CBCT data sets were re-oriented according to the following protocol. In the coronal plane, the most inferior point on the infraorbital margin of both sides lies on the same horizontal plane. In the sagittal plane, the Frankfort plane extends through the ANS (Anterior Nasal Spine) and PNS (Posterior Nasal Spine) points, which are parallel to a horizontal plane. In the axial plane, the plane extending through the ANS to the PNS is perpendicular to the horizontal plane.
The segmentation protocol utilized an airway module where the slice that coincided with the midsagittal plane was selected for the optimal airway view. Anatomic landmark points are connected to form a region of interest in the upper airway, using ruler measurements to delineate the region. After that, 3 “seed points” were added to the center of the region of interest of the nasopharynx, oropharynx, and hypopharynx; these points were used to “expand the airway” (Fig. 1). This method is an automatic segmentation (Fig. 2).
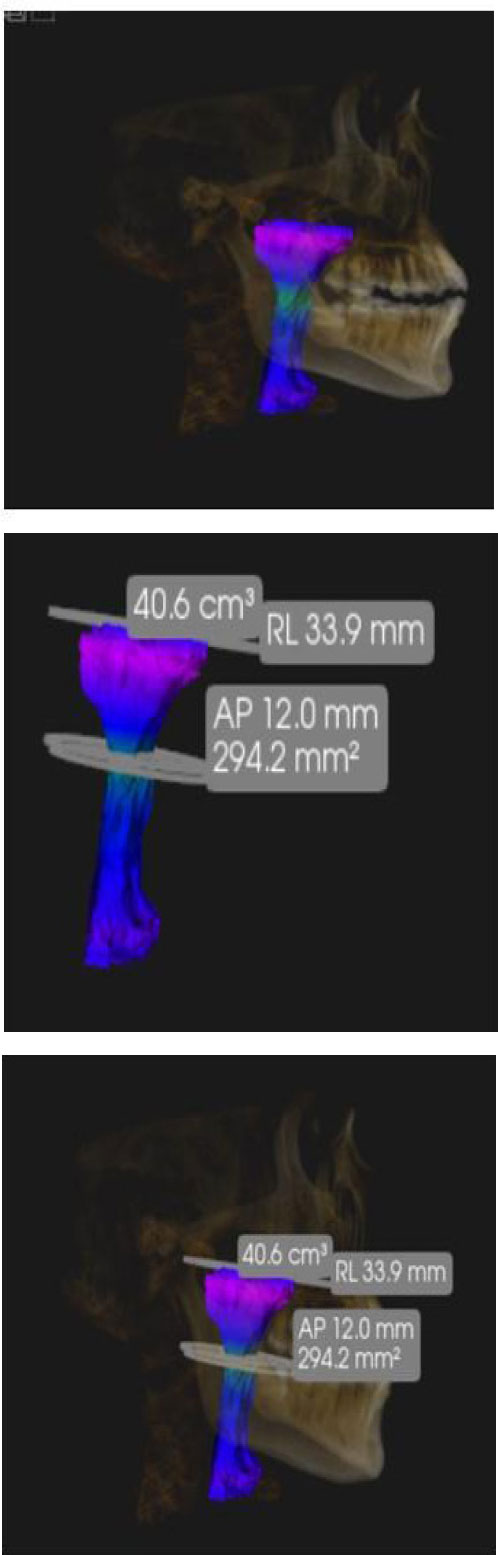
3D segmentation and measuring results (CS 3D Imaging Software 7.0.23 by Carestream Dental, Atlanta). Upper airway segmentation with 3D adjustment (A) and (B), measurement findings for total upper airway volume in cm3, CSAmin in mm2, and Lateral and Anteroposterior CSAmin in mm (C).
The data collected were sorted and categorized based on the parameters recorded. The upper airway measurement parameters are as follows Total volume upper airway (cm3), Minimum cross-sectional area (CSAmin) (mm2), Lateral dimension CSAmin (mm), and Anteroposterior dimension CSAmin (mm).
2.1. Statistical Analysis
The data were analyzed using statistical software. A reliability test was performed by two examiners using the Intraclass Correlation Coefficient (ICC). The null hypothesis stated that no statistically significant relationship exists between upper airway measurement parameters (total volume upper airway, minimum cross-sectional area (CSAmin), lateral dimension CSAmin, anteroposterior dimension CSAmin) and demographic variables (age, gender, BMI). Data were analyzed using descriptive statistical methods, group comparison tests, and correlation analysis by Spearman’s Rho.
3. RESULTS
Inter-rater reliability for upper airway measurement parameters was excellent (ICC = 0.99), while intra-rater reliability ranged from 0.80 to 0.89, indicating good upper airway measurement consistency. A total of 85 CBCT datasets were included in the analysis (45 males, 52.9%; 40 females, 47.1%). The participants were divided into two age groups: 20-30 years (n= 46) and 31-40 years (n= 39) (Table 2). The BMI categories consisted of underweight (16.5%), normal weight (51.8%), and overweight (31.8%) (Table 3).
| Gender | 20–30 years, n (%) | 31–40 years, n (%) | Total, n (%) |
|---|---|---|---|
| Male | 22 (25.9) | 23 (28.2) | 45 (52.9) |
| Female | 24 (28.2) | 16 (18.8) | 40 (47.1) |
| Total | 46 (54.1) | 39 (45.9) | 85 (100.0) |
| Gender | Underweight, n (%) | Normal, n (%) | Overweight, n (%) | Total, n (%) |
|---|---|---|---|---|
| Male | 3 (3.5) | 26 (30.6) | 16 (18.8) | 45 (52.9) |
| Female | 11 (12.9) | 18 (21.2) | 11 (12.9) | 40 (47.1) |
| Total | 14 (16.5) | 44 (51.8) | 27 (31.8) | 85 (100.0) |
The mean total Upper Airway (UA) volume showed significant differences between genders with males presenting higher values than females (31.7 ± 7.0 cm3 vs. 27.1 ± 5.0 cm3; p < 0.05), likewise, significant differences were also observed across BMI categories (p < 0.05), where individuals with normal BMI exhibited the highest UA volumes (33.2 ± 5.9 cm3) compared to underweight (27.4 ± 6.4 cm3) and overweight participants (24.6 ± 3.0 cm3) (Table 4). There are no significant differences in total UA volume between the two age groups (p > 0.05). For other airway parameters, including CSAmin, lateral CSAmin, and anteroposterior CSAmin, no statistically significant differences were observed across age group, gender, or BMI.
| - | Total Volume Upper Airway (cm3) | CSAmin (mm2) | CSAmin Lateral (mm) | CSAmin Anteroposterior (mm) |
|||||
|---|---|---|---|---|---|---|---|---|---|
| Mean ± SD | p-value | Mean ± SD Median (Min-Max) |
p-value | Mean ± SD Median (Min-Max) |
p-value | Mean ± SD | p-value | ||
| Age Group | 20-30 tahun | 30.0 ± 6.2 | 0.001*a | 151.3 ± 78.7 | 0.563a | 22.5 ± 7.2 | 0.960a | 9.1 ± 2.7 | 0.695 a |
| 31-40 tahun | 29.0 ± 6.9 | 141.7 ± 71.8 | 22.5 ± 6.8 | 8.9 ± 3.0 | |||||
| Gender | Male | 31.7 ± 7.0 | 0.001*a | 138.7 (24.3-324.1) |
0.871b | 21.8 ± 7.2 | 0.352a | 9.3 ± 3.0 | 0.357 a |
| Female | 27.1 ± 5.0 | 130.8 (33.2-365.4) |
23.2 ± 6.9 | 8.7 ± 2.5 | |||||
| Body Mass Index | Underweight | 27.4 ± 6.4 | 0.000*c | 157.7 ± 58.2 | 0.398c | 24.4 (10.5-33.5) |
0.410d | 9.0 ± 2.0 | 1.000 a |
| Normal | 33.2 ± 5.9 | 153.4 ± 84.7 | 22.2 (9.9-45.7) |
9.0 ± 3.3 | |||||
| overweight | 24.6 ± 3.0 | 130.6 ± 66.0 | 9.9 (12.3-30.5) |
9.0 ± 2.3 | |||||
Note: a t-test ndependent
b Mann-Whitney
c One-way ANOVA
d Kruskal-Wallis
* p-value <0.05
Spearman’s correlation revealed weak but statistically significant negative correlations between total UA volume and both gender (r = –0.327, p < 0.05) and BMI (r = –0.326, p < 0.05). Age showed no significant correlation with any airway parameter (p > 0.05). All CSAmin values in this study exceeded 110 mm2, indicating that participants were generally not at anatomical risk for obstructive sleep apnea based on previously defined CSAmin thresholds (Table 5).
| - | Total Volume Upper Airway | CSAmin | CSAmin Lateral | CSAmin Anteroposterior | ||||
|---|---|---|---|---|---|---|---|---|
| Correlation (r) | p-value | Correlation (r) | p-value | Correlation (r) | p-value | Correlation (r) | p-value | |
| Age Group | -0.100 | 0.364 | -0.40 | 0.713 | -0.06 | 0.960 | -0.57 | 0.606 |
| Gender | -0.327 | 0.002* | 0.18 | 0.872 | 0.079 | 0.471 | -0.80 | 0.468 |
| Body Mass Index | -0.326 | 0.002* | -0.166 | 0.128 | -0.138 | 0.207 | 0.017 | 0.879 |
Note: * p-value < 0.05.
4. DISCUSSION
The upper airway is a dynamic anatomical structure composed of mucosal, muscular, cartilaginous, and lymphatic components that contribute to respiration and phonation [11, 12]. Alterations in airway morphology are clinically relevant because of reduced airway dimensions [3]. Establishing normative upper airway measurements in healthy populations is critical for identifying deviations that may indicate pathological risk.
The rising prevalence of alteration of the upper airway has been accompanied by advances in diagnostic imaging modalities for evaluating maxillofacial anatomical structures of the upper airway [11]. However, conventional techniques remain limited by factors such as non-linear magnification, image distortion, and superimposition of craniofacial structures, which complicate accurate upper airway assessment [8]. A study by Feng et al. comparing total upper airway volume obtained from lateral cephalometry and CBCT in individuals aged < 15 and > 15 years reported a moderate negative correlation (r= -0.32). In that study, the Fujioka method, specifically the Adenoidal Nasopharyngeal Ratio (ANR) derived from lateral cephalometric analysis, was used as a reference for airway volume estimation. Nevertheless, ANR has limited accuracy, as it does not account for physiological variables and is restricted to assessing nasopharyngeal capacity alone [6].
This study found that the volume of the upper airway was significantly greater in males than in females, consistent with previous findings. Elagib et al. reported a similar sex-based difference in a South Korean cohort, with males exhibiting larger total airway volumes than females [2]. Di Carlo et al. reported that male participants consistently showed larger three-dimensional airway dimensions in orthognathic surgery populations [12]. These differences may be attributed to the larger craniofacial dimensions, greater oropharyngeal soft tissue volume, and differences in fat distribution patterns in males compared to females [8]. This study reinforces these observations by demonstrating a weak but statistically significant correlation between total airway volume and gender.
Body Mass Index (BMI) was also significantly associated with upper airway volume. Participants with normal BMI exhibited the highest airway volumes, whereas those with overweight showed reduced volumes. This finding aligns with studies indicating that increased adiposity, particularly parapharyngeal fat deposition, may contribute to airway narrowing.
Dastan et al. reported comparable results in an Iranian population, showing a significant relationship between airway volume, craniofacial characteristics, and BMI [13]. A weak correlation was found in this study; it remains clinically relevant, as even small volumetric reductions may contribute to airway collapsibility, especially in predisposed individuals.
On the other hand, age did not correlate significantly with upper airway parameters in this 20-40 year old cohort. This is consistent with reports that airway morphology remains relatively stable in early and mid-adulthood and tends to decline only after the fifth decade of life due to progressive soft-tissue laxity and structural remodeling [14]. Since participants in this study were limited to younger adults with presumably stable craniofacial growth, large age-related volumetric differences were not expected.
An important observation from this study is that all CSAmin measurements exceeded 110 mm2, a threshold previously associated with reduced OSA risk [11]. This supports the classification of the present sample as a healthy, low-risk population. CSAmin remains a critical parameter because minimal cross-sectional area rather than total airway volume has been shown to be the most predictive indicator of potential airway obstruction.
The use of CBCT provided high-resolution three-dimensional visualization and reliable segmentation of the upper airway. Both inter-and intra-rater reliability in this study were high, reinforcing the reproducibility of CBCT-based airway assessment [11]. This is consistent with findings by Zimmerman et al. [15] and Daya et al. [3], who reported excellent reliability for CBCT-based upper airway measurements when standardized protocols are applied. Despite its advantages, CBCT interpretation must consider patient positioning and breathing phase, as variations in head posture and airway tone can influence volumetric measurements [16].
Overall, this study contributes population-specific normative data for healthy Indonesian adults, a group underrepresented in existing literature. Differences in craniofacial structure across ethnicities make such local data essential for clinical interpretation and accurate risk assessment. Further investigation using larger and more varied samples is required to refine the reference ranges and examine other factors such as craniofacial morphology, soft-tissue characteristics, and functional respiratory assessments.
5. STUDY LIMITATION
This cross-sectional study has several limitations. The retrospective design and relatively small sample size from a single institution may limit the generalizability of the findings. Potential selection bias may also exist because CBCT scans were initially taken for clinical purposes. Additionally, factors such as patient positioning, breathing phase, and unmeasured anatomical or lifestyle variables could have influenced airway measurements. Future studies with larger and more diverse samples, as well as prospective designs, are needed to validate these results.
CONCLUSION
The findings of this study can be summarized as follows:
- The Upper Airway (UA) volume is significantly associated with gender and BMI, but not with age, in healthy adults aged 20-40 years.
- The factors that influence UA volume include craniofacial dimensions, oropharyngeal soft tissue, and fat distribution.
- Assessment of UA volume should consider head positioning to ensure accurate representation.
- Three-dimensional CBCT provides reliable measurements for UA evaluation.
- CBCT may support early identification of airway alterations in clinical practice.
AUTHORS’ CONTRIBUTIONS
The authors confirm contribution to the paper as follows: HB-I, M.P., B.K., B.T.P.: Study Conception and design; B.T.P.: Data Collection; HB-I, M.P., B.K., B.T.P.: Analysis and interpretation of results; HB-I, M.P., B.K., B.T.P.: Draft manuscript. All authors reviewed the results and approved the final version of the manuscript.
LIST OF ABBREVIATIONS
| PNS | = Posterior Nasal Spine |
| ANS | = Anterior Nasal Spine |
| ICC | = Intraclass Correlation Coefficient |
| CBCT | = Cone-Beam Computed Tomography |
ETHICS APPROVAL AND CONSENT TO PARTICIPATE
The study was approved by the Research Ethics Committee of the Faculty of Dentistry, Universitas Indonesia (Number: 68/Ethical Approval/FKGUI/XI/2023).
HUMAN AND ANIMAL RIGHTS
All human research procedures followed were in accordance with the ethical standards of the committee responsible for human experimentation (institutional and national), and with the Helsinki Declaration of 1975, as revised in 2013.
CONSENT FOR PUBLICATION
Informed consent was waived by the Ethics Committee of the Faculty of Dentistry, Universitas Indonesia, because this study used retrospectively collected and fully anonymized CBCT datasets, posing minimal risk to participants.
AVAILABILITY OF DATA AND MATERIALS
The data supporting the findings of the article are available at the Dental Hospital of the Faculty of Dentistry, Universitas Indonesia.
FUNDING
This study was funded by the International Indexed Publication Grants (PUTI) Q3 (Grant NKB.-96/UN2.RST/ HKP.05.00/2024) Universitas Indonesia 2024.
ACKNOWLEDGEMENTS
Declared none.